Professor Sangtae Kim and the Linear Diffusion Model
Research Impact
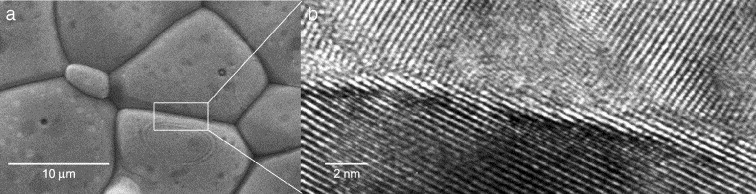
Optimizing the performance of electrolytes used in alternative energy technologies such as solid oxide fuel cells, and batteries relies on measuring and understanding the transport of oxide and lithium (Li) ions (O2- and Li+) and/or protons (H+) in ceramic materials. These ceramic materials are most commonly synthesized and processed in the form of polycrystalline aggregates that consist of crystalline grains separated by grain boundaries (see for example Figure 1(a) for an example of a scanning electron microscopy (SEM) image of a polycrystalline Ce₀.₉₉ Gd₀.₀₁O₂₋ₓ sample).
These grain boundaries are characterized by atomic arrangements that differ from those within the grains (see Figure 1b for a high-resolution transmission electron microscopy [HR-TEM] image), and though they constitute a small fraction of the total volume of the sample, they often define the overall electrical resistivity of the entire ceramic material. The problem is particularly complicated because grain boundary resistance may arise from a variety of sources, which means their structural, chemical and electrical nature remains a subject of heated debate in the field of solid state ionics.
The Linear Diffusion Model
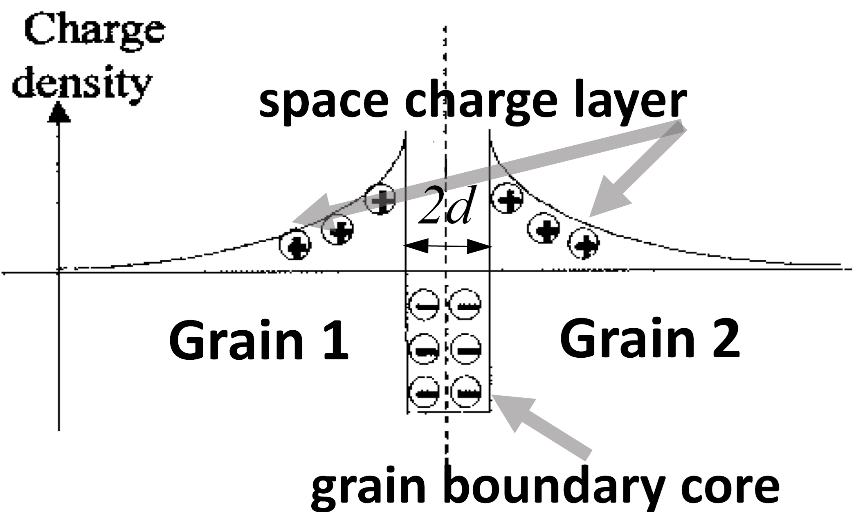
Faced with the challenge of describing the electrical behavior of the grain boundary across a wide range of ceramic materials and irrespective of grain size, professors Sangtae Kim and Igor Lubomirsky developed a non-destructive method to analyze the nature of grain boundary resistance and to determine the most important characteristic parameters to describe these grain boundaries. This resulted in the development of the Linear Diffusion Model (LDM). This predictive model takes into account the fact that the grain boundary cores are not only structurally different from the grain interior (i.e., differences in atomic arrangements) but also are often chemically different and characterized by an enrichment of charges of the same sign as that of the mobile ions. To maintain electrical neutrality, the charges redistribute and form an oppositely-charged space charge layer (SCL) around the core (Figure 2) which can prevent charges from moving from one grain to another through the SCL.
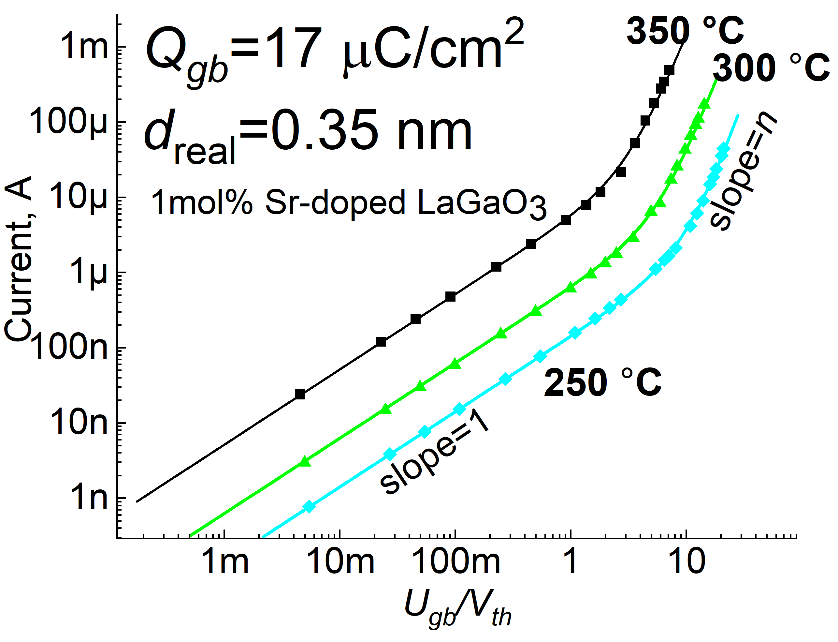
The grain boundary resistance can be characterized by performing impedance spectroscopy, from which current – voltage (I-V) curves can be constructed. When plotted on a log(I) vs. log(Ugb/Vth) scale where Ugb is the voltage dropped across the grain boundary and Vth is the thermal voltage, the LDM predicts the existence of two linear regimes. For Ugb/Vth<1, the slope of the I-V curves equals to 1. This regime is referred to as the Ohmic regime, as the grain boundaries behave as a resistor. This second linear region for 10< Ugb/Vth <80 has a slope, n, larger than 1, so that the current is proportional to a power of applied voltage: I∝Uⁿgb.
In this “SuperOhmic” regime, the amount of ions injected into the SCL becomes comparable with the trapped space charge, leading to a rapid increase in the concentration of ions in the depletion region. As shown in Figure 3, the LDM accurately reproduces the experimental data for several families of oxygen ion and proton conductors using only two parameters—the trapped charge density, Qgb µC/cm2, and grain boundary core thickness, d=0.35 nm.
The LDM is capable of 1) predicting the grain boundary potential, Ψgb; 2) separating the grain boundary resistance caused by trapped charges from that due to contaminants and segregation to grain boundaries; 3) calculating the amount of charge trapped at grain boundaries, Qgb, and estimating the grain boundary core thickness, d; and 4) providing a criterion to verify its applicability.